Source code
Geospatial analysis is an effective tool supporting the planning, implementation and monitoring of basic services delivery in developing countries, as reflected by an increase in use in a number of geographies and sectors. Within the energy sector, the use of GIS data and associated analytical tools can be beneficial in conducting strategic planning as well as prioritizing and rationalizing energy infrastructure related investments. The World Bank, ESMAP and KTH Division of Energy Systems Analysis have developed National High Resolution Dynamic Least Cost Options Plan for Universal Access to Electricity in Nigeria, Tanzania and Zambia. The web-based open source application presented here allows the users to select scenarios based on electricity consumption targeted (Tiers of access) and spatially related fuel costs towards identifying the least cost electrification technology for every settlement at a 1 by 1 km resolution.
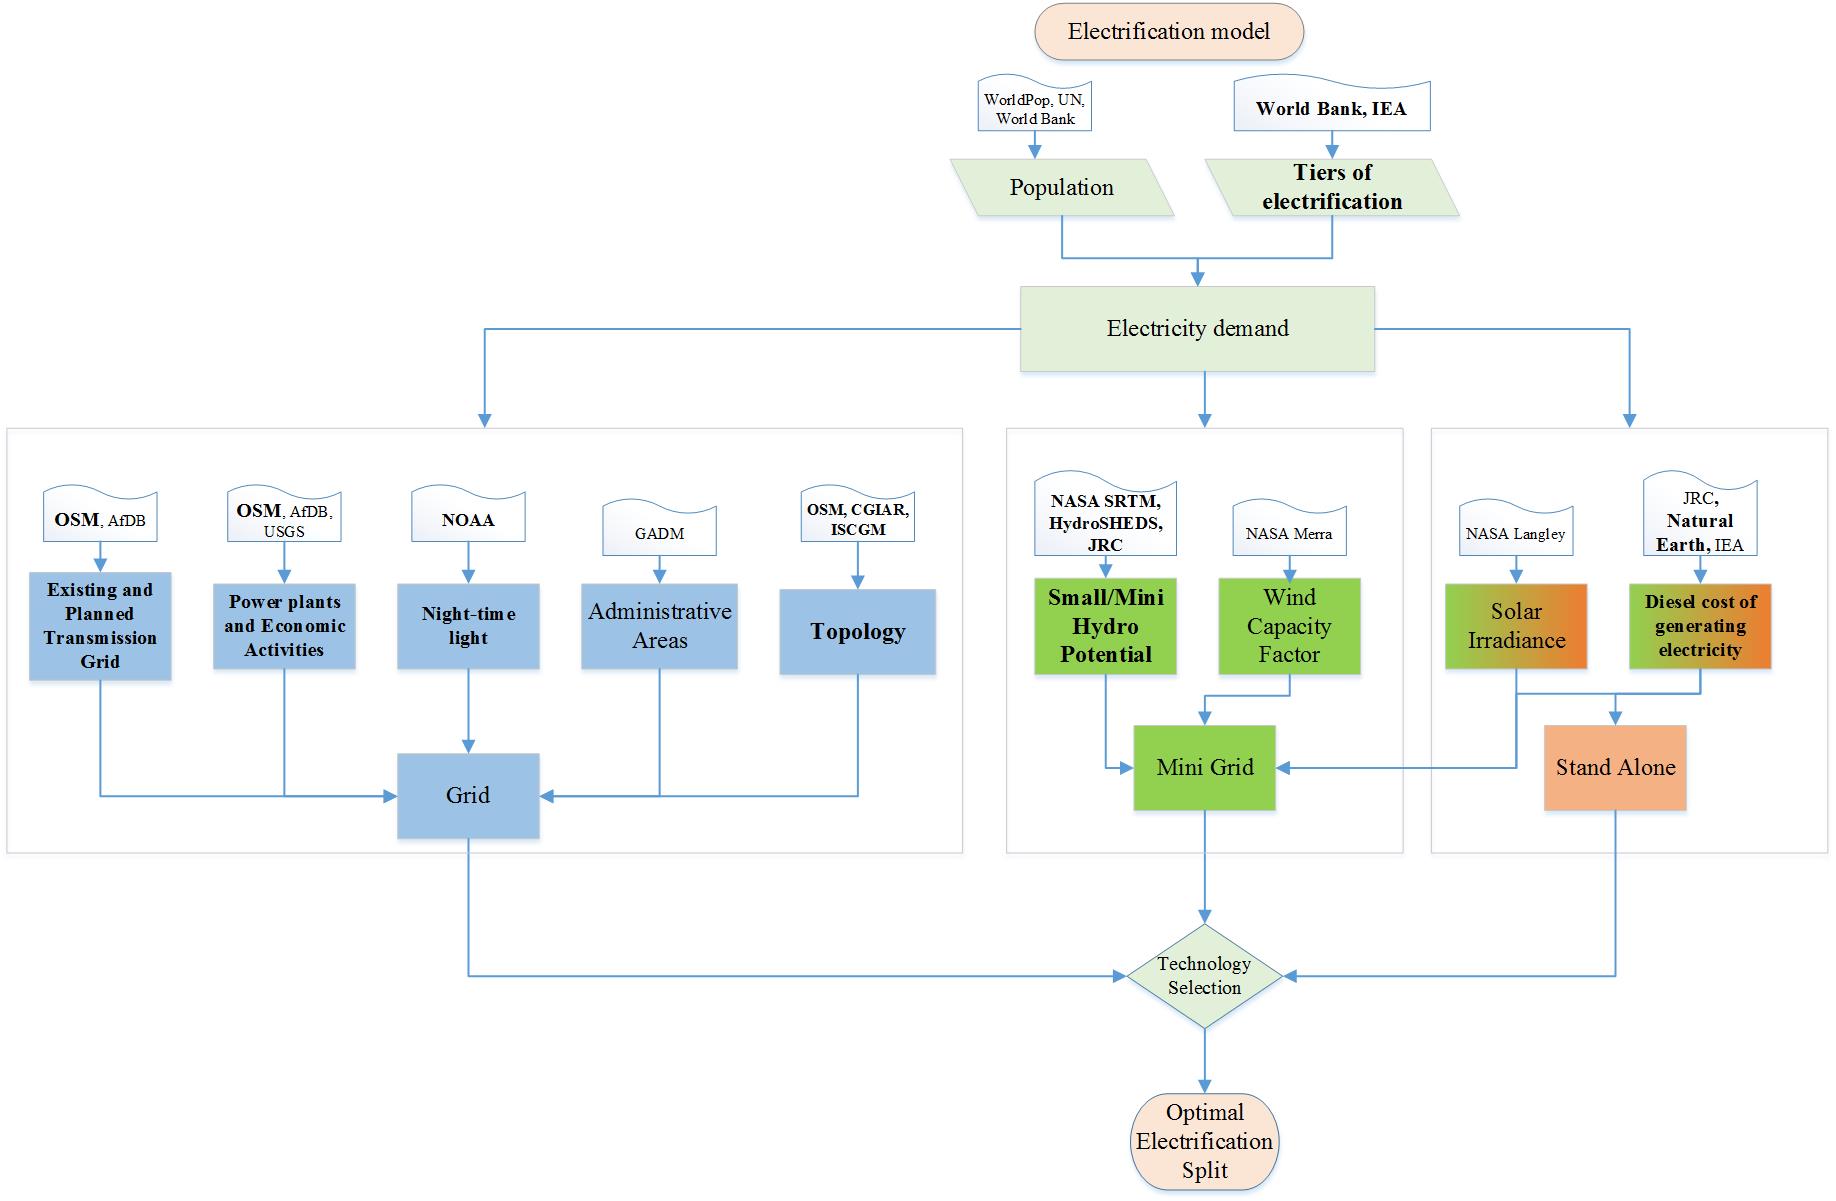
This GIS based application allows users to navigate through the least cost electrification options for each settlement of 1 by 1 km in Nigeria, Tanzania and Zambia. The technology decision depends on several spatial parameters available for download on energydata.info.
These include population density, distance from existing and planned transmission infrastructure, proximity to road network, night-time light, as well as energy resource availability. For each location, seven electrification technologies are compared and the least cost system is selected depending on the tiers of access aimed for. In other words, the technology offering the lowest levelized cost of electricity generated throughout its lifetime, is considered as the best electrification solution. Results are available for each settlement. Summaries are provided in national, state and district level.
This electrification planning toolkit is a complementary approach to already existing energy planning models that do not consider geospatial attributes related to energy. It can be used as a screening tool to inform decision making in the energy field and to bridge science, technology and policy at different levels. The peer-reviewed underlying methodology can be found [1], [2] and the underlying assumptions the model uses are available here.
The quality of the tool's results is directly correlated to the quality of data inputs. It is important to note that the tool has been developed using best available open data. Data gaps and data quality issues, particularly in regards to electricity grid location and electricity use significantly affect the model’s outputs. As such, the tool should be seen as a demonstration project providing results of strategic value, rather than an investment planning tool.
Covering future electricity demand requires investments in new generating capacity, with two main options to be considered. On the one hand new capacity can be added to the national electricity grid which will then electrify un-served areas through an extended T&D network spanning throughout the country. On the other hand, new off-grid capacity can be added, operating either in a form of mini-grids or stand-alone systems covering the demand in each location based on the locally available energy resources.
Grid electricity is generated in a centralized manner, usually from large power plants, which due to economies of scale are able to offer low generating costs. Electricity then reaches households through the Transmission and Distribution network in relatively low costs (if the T&D network is well developed e.g. developed countries). However, the expansion of the electricity grid infrastructure in a country, is a capital intensive and time demanding process, which requires long term planning and large investments. A reasonable investment recovery time horizon of such investments requires in turn a population with high purchasing power and sophisticated consumption patterns. It might not be economically feasible to extend the central grid if the population to be served will only demand, and afford, a relatively small quantity of electricity. Therefore, grid extension might not be the optimal electrification option for low income – low consumption population in rural areas and particularly in remote areas of developing countries.
A mini grid is an important alternative to grid extension. In this case electricity is generated in a decentralized manner, usually from power plants with generating capacity of few MW. Mini grids are usually deployed based on locally available energy resources such as solar, hydro, wind or can be based on commonly available fuels like diesel. Requiring no transmission and modest distribution costs mini grids can provide affordable electricity to rural, remote and usually densely populated areas with low-medium electricity consumption habits. Mini grids based on renewable sources have usually high upfront costs but limited operational costs (i.e. fuel). On the other hand, diesel generators (gensets) are a mature, low cost technology subjected however to operational costs depending on diesel pump price fluctuation.
Stand-alone systems are usually based on local energy resources in order to produce few kWh per day, able to cover the electricity demand of a single household. These systems do not require T&D network; therefore, their capital cost depends only on their size. Batteries may increase the upfront cost for PV systems while diesel gensets are a mature, low cost technology subjected however to operational costs depending on diesel pump price fluctuation. Stand-alone systems are a good electrification option for remote, low populated areas with limited electricity consumption needs.
The electrification planning exercise is carried out for 10 alternative scenarios defined by 5 indicative quantities of electricity consumption (Tiers of access) and two diesel prices.
Each tier represents different levels of electricity services provided starting from basic lighting and recharging a cell phone or a radio (Tier 1) to services that provide comfort and productivity, as for example general lighting and continuous use of heavy appliances, such as refrigeration, agricultural processing appliances and eventually cooking. (see Table). From first to fifth, scenarios increase based on the quality and the quantity of the electricity delivered to the end consumer.
| Level of access | Tier-0 | Tier-1 | Tier-2 | Tier-3 | Tier-4 | Tier-5 |
|---|---|---|---|---|---|---|
| Indicative appliances powered | Torch and Radio | Task lightning + Phone charging or Radio |
General lightning + Air circulation + Television |
Tier 2 + Light appliances (i.e. general food processing and washing machine) |
Tier 3 + Medium or continuous appliances (i.e. water heating, ironing, water pumping rice cooking, refrigeration, microwave) |
Tier 4 + Heavy or continuous appliances (i.e. air conditioning) |
| Consumption per household and year (kWh) |
- |
22 |
224 |
695 |
1800 |
2195 |
The model assumes two international diesel prices, 0.34 US$ per liter (current international diesel price) and 0.82 US$ per liter (projected international diesel price), used to calculate diesel costs in different localities [3]
| Diesel Level | Price |
|---|---|
| High | 0.82 US$/liter |
| Low | 0.34 US$/liter |
The tool allows the selection of the three studied countries. Once in a country page, a brief overview of the country’s status in terms of demographics, economy and electricity access is provided.
These data include:
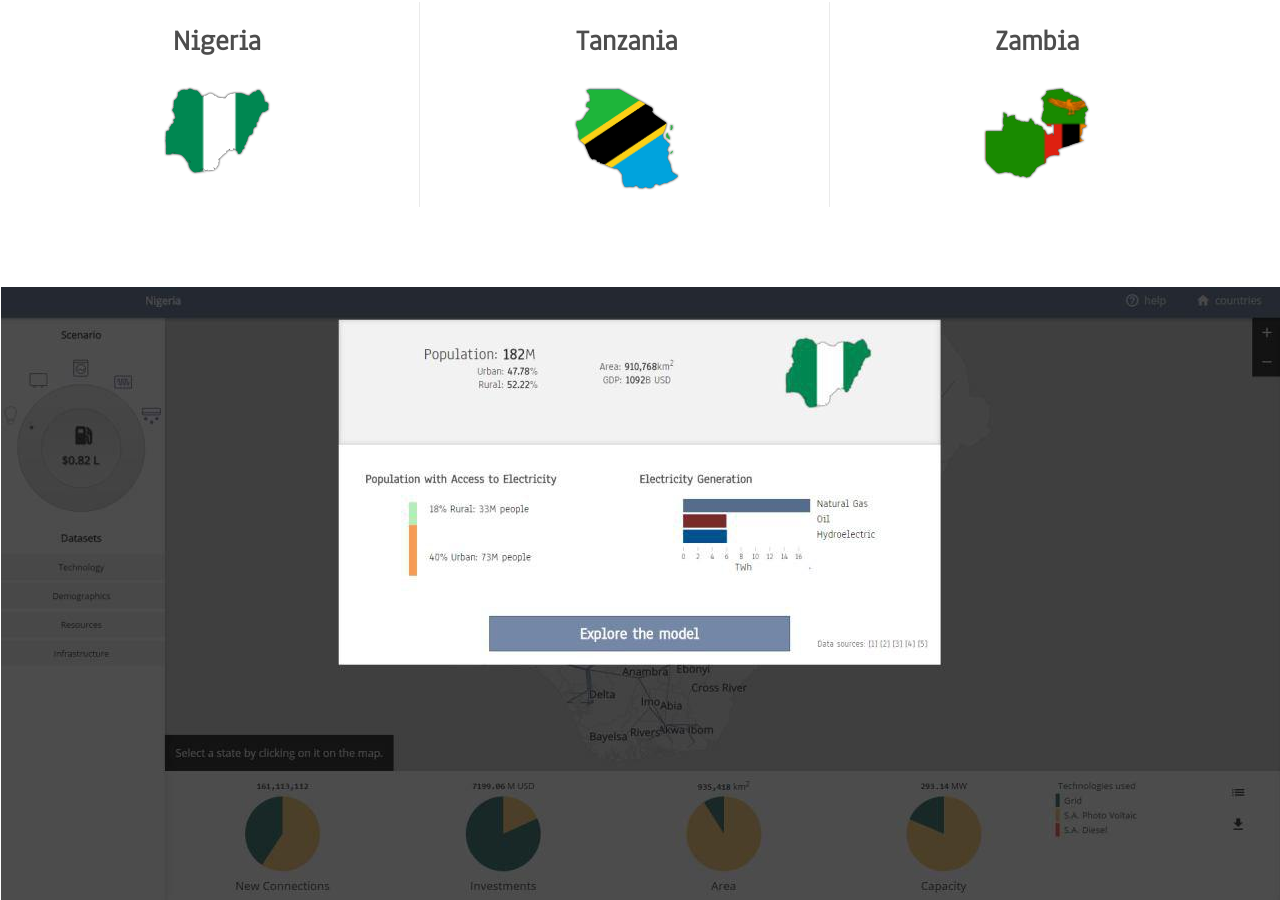
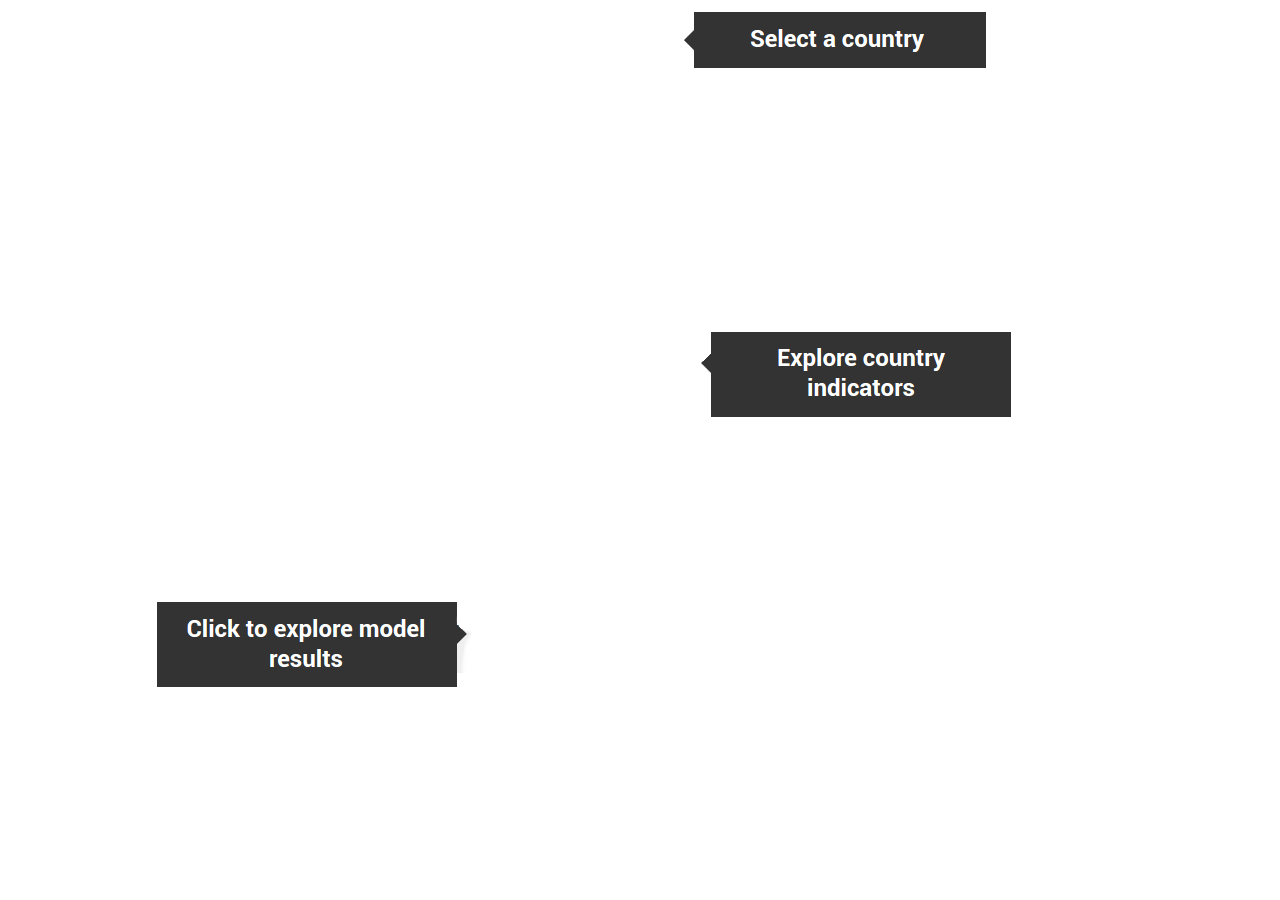
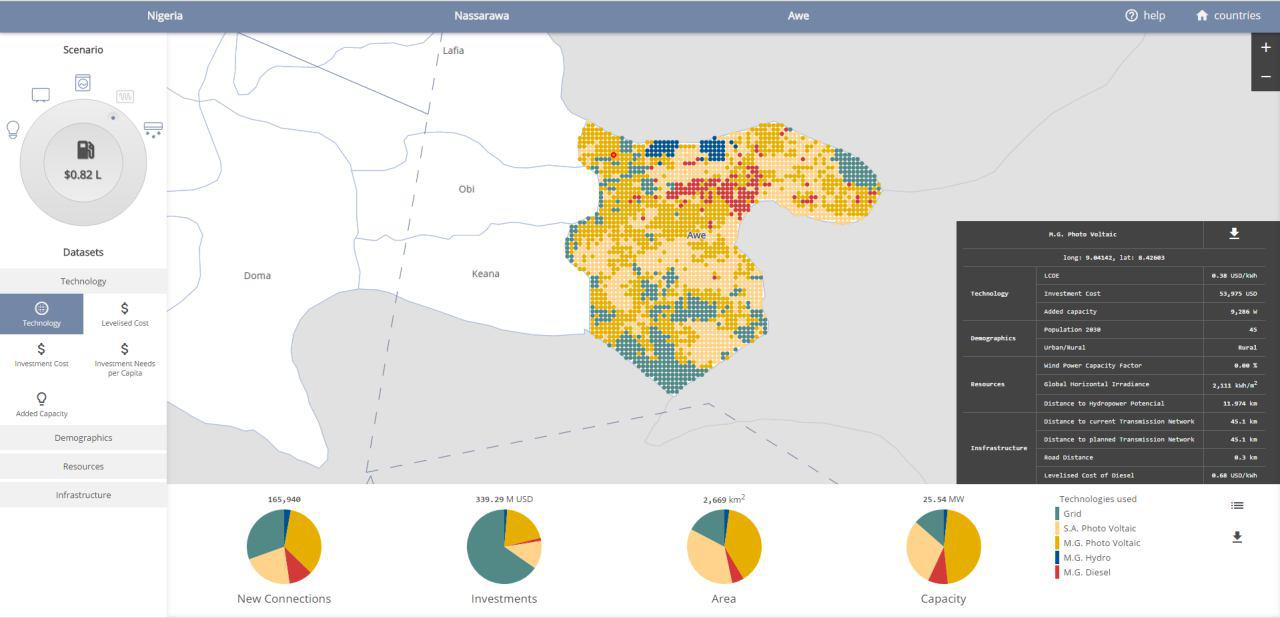
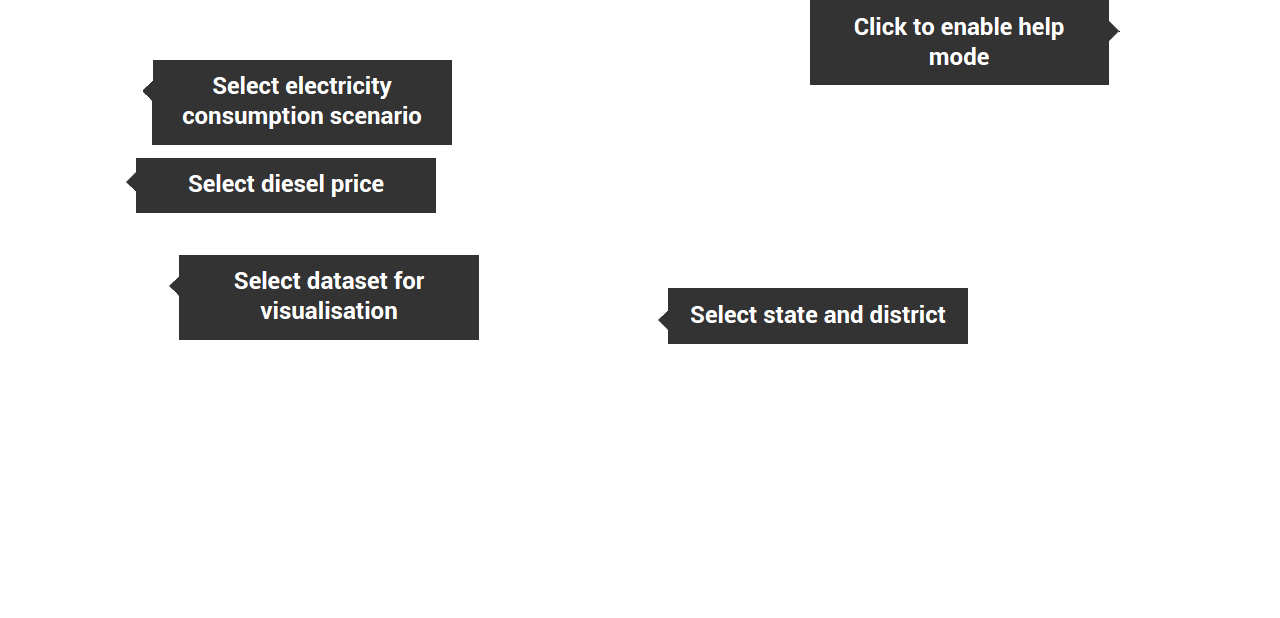
The visualization displays buttons to select one of the two diesel prices and one of the electricity consumption levels or tiers. It shows a map of the selected country. On the bottom of the page, a summary of the model results is presented. This includes - for the selected scenario - the share of each electrification technology for new connections, investment needs, area and added capacity.
You can further select a state and a district and select among several datasets to be visualized. The default dataset is the least cost electrification technology. Datasets are grouped in 4 categories:
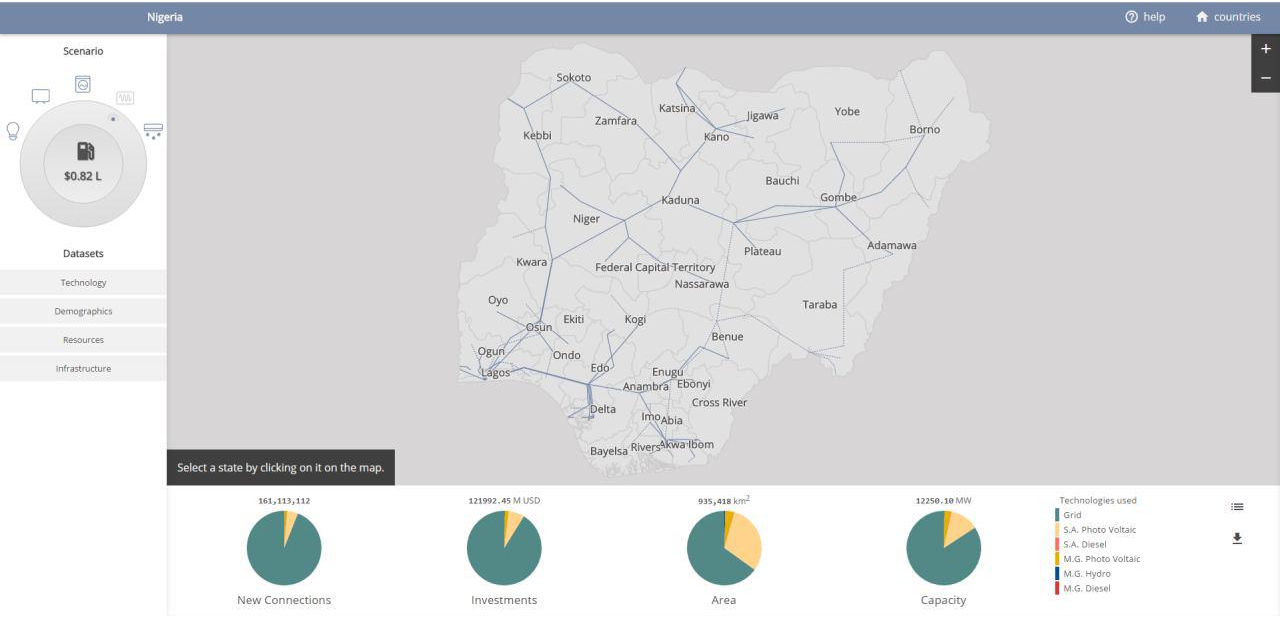
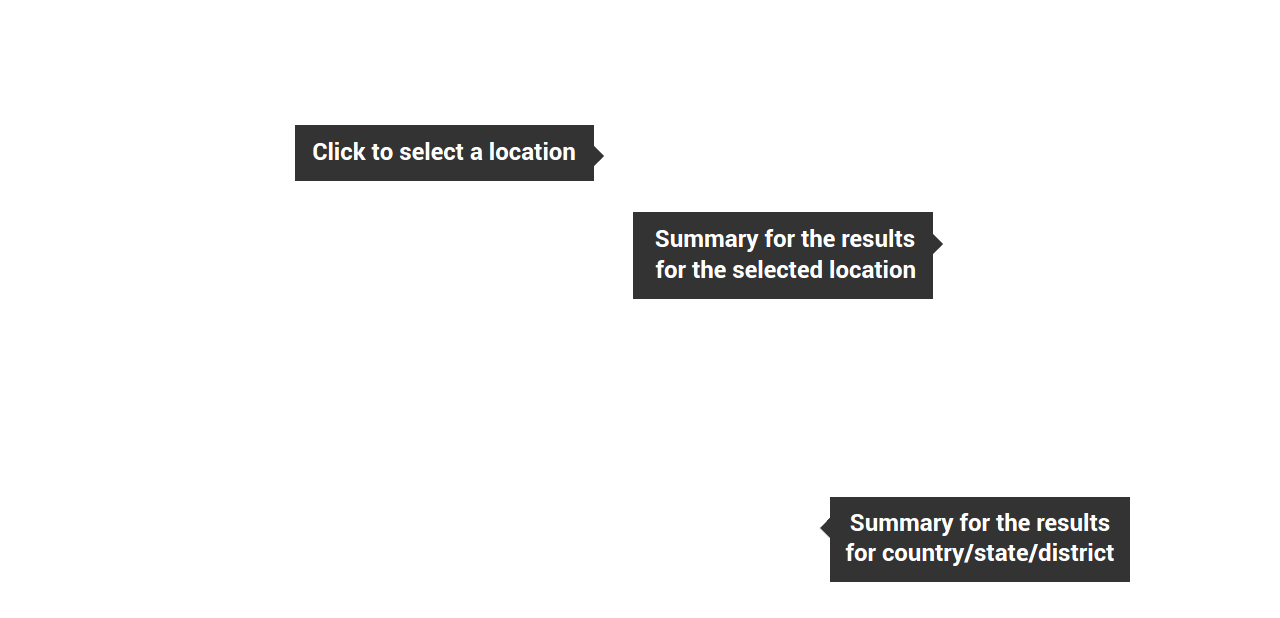
Once in a district (or local government area), you can click to select a specific location. A summary of the results for the selected location is provided on the top right hand side of the page. On the bottom of the page, results are summarized for the considered district.